> ## Documentation Index
> Fetch the complete documentation index at: https://www.towbar.dev/llms.txt
> Use this file to discover all available pages before exploring further.

# Scout Alerts

> Configure metric alerts, public HTTP checks, and Slack or email notifications in Towbar.

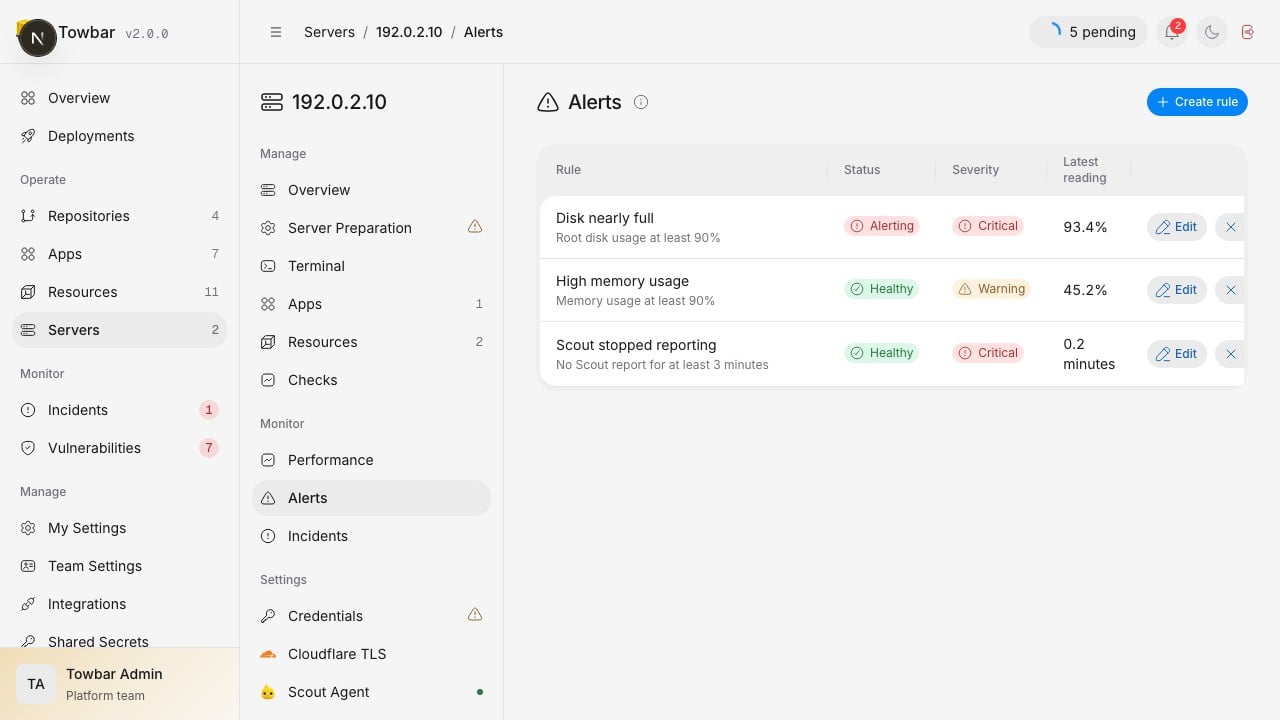
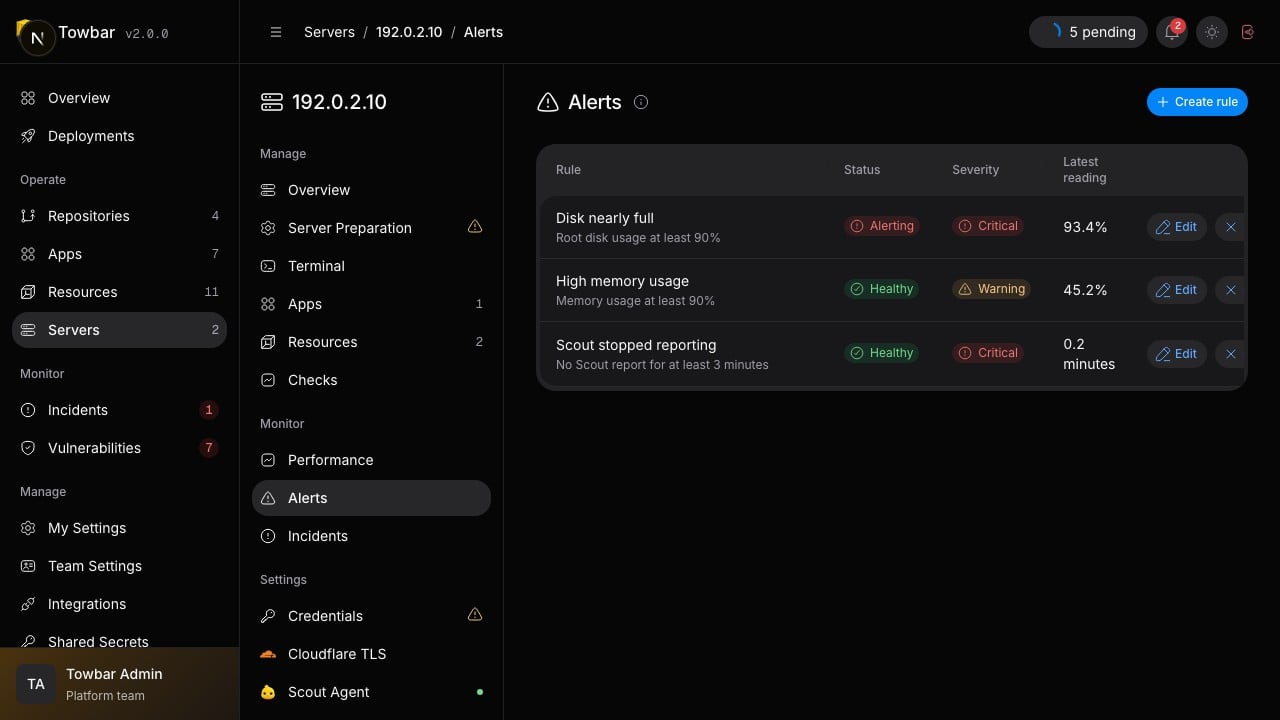
Scout Alerts turns performance measurements into incidents you can act on. Open **Server → Monitor → Alerts** to create rules and inspect active or resolved incidents. Each server, app, or resource page shows only its own rules and incidents in **Monitor → Alerts**. New rules automatically monitor the entity whose page you are viewing.

No rules are enabled automatically. The dotted 80% line in performance charts is a visual reference, not a notification threshold.

<div className="towbar-doc-screenshot">
  <div className="towbar-product-light">
    <img src="https://mintcdn.com/avgeek/7IKQY5hBmeQaVMw0/assets/release-v2/scout-alerts-light.jpg?fit=max&auto=format&n=7IKQY5hBmeQaVMw0&q=85&s=eb21a8e7c97eb9ffea407127bdb070da" alt="Alert rules show their current state, severity, and latest reading." width="1280" height="720" loading="lazy" data-path="assets/release-v2/scout-alerts-light.jpg" />
  </div>

  <div className="towbar-product-dark">
    <img src="https://mintcdn.com/avgeek/7IKQY5hBmeQaVMw0/assets/release-v2/scout-alerts-dark.jpg?fit=max&auto=format&n=7IKQY5hBmeQaVMw0&q=85&s=950db911f69b80b4b47030fa8f424c0f" alt="Alert rules show their current state, severity, and latest reading." width="1280" height="720" loading="lazy" data-path="assets/release-v2/scout-alerts-dark.jpg" />
  </div>

  <p>Alert rules show their current state, severity, and latest reading.</p>
</div>

## Create a rule

1. Choose **Create rule**, enter a rule name, then choose a metric.
2. The current server, app, or resource is selected automatically. Workload rules select **Production** or **Previews**; preview rules consider the selected workload's preview instances together.
3. Set the threshold and direction. **At least** and **At most** include the threshold itself.
4. Choose whether the rule is enabled, then save. All configured notification destinations receive alerts and recoveries automatically.

A server without notification destinations still creates incidents in Towbar. Adding a destination does not send an immediate test; a firing incident becomes eligible on the next evaluation. Admins and Members can create, change, enable, disable, or delete rules. Viewers can inspect them.

| Example rule            | Trigger                              | Recovery                            |
| ----------------------- | ------------------------------------ | ----------------------------------- |
| Disk nearly full        | Root disk at least 90%               | Disk falls below 90%                |
| High memory usage       | Memory at least 90%                  | Memory falls below 90%              |
| High CPU usage          | CPU at least 90%                     | CPU falls below 90%                 |
| Container restart loop  | At least 3 restarts within 5 minutes | Fewer than 3 restarts in the window |
| Scout stopped reporting | No report collected for 3 minutes    | Reports resume                      |

The examples above are starting points for your own thresholds. Configure restart counting windows from 1 to 60 minutes. Alerts fire on the first fresh qualifying reading, with no additional waiting period. An incident recovers on the first fresh measurement that no longer meets the trigger condition. Each incident sends one firing notification, with no repeats while active. Each server, app, or resource supports up to 10 alert rules, including disabled rules. Delete a rule to free a slot. Production and preview rules share the same entity limit. A server supports up to 100 rules across all its entities, including at most 10 public HTTP checks.

## Workspace monitoring

The **Monitor** sidebar section brings your workspace together:

* **Incidents** lists active and resolved incidents across the workspace, with pagination and a severity filter. **View Incident** opens the details drawer on this page.
* **Vulnerabilities** lists package findings from the latest app image scans.

The sidebar shows active incidents and critical or high vulnerabilities in red counts. Counts refresh every 30 seconds and disappear at zero.

## Inspect an incident

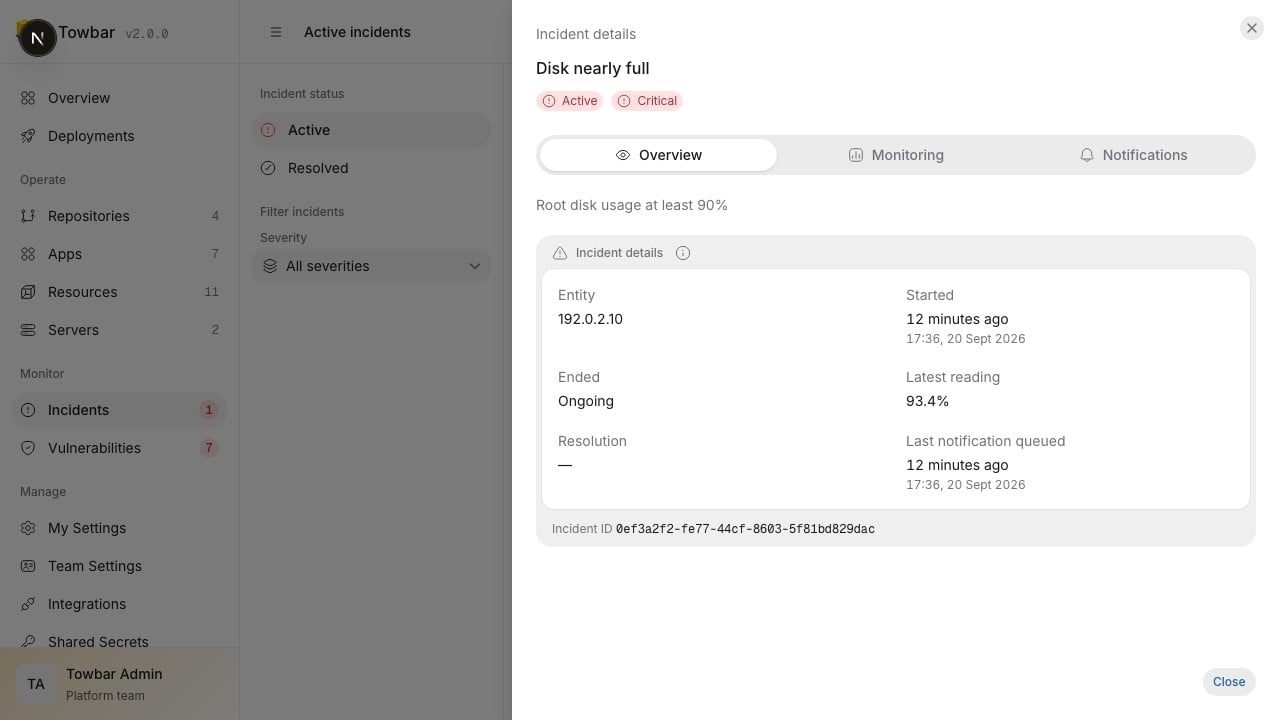
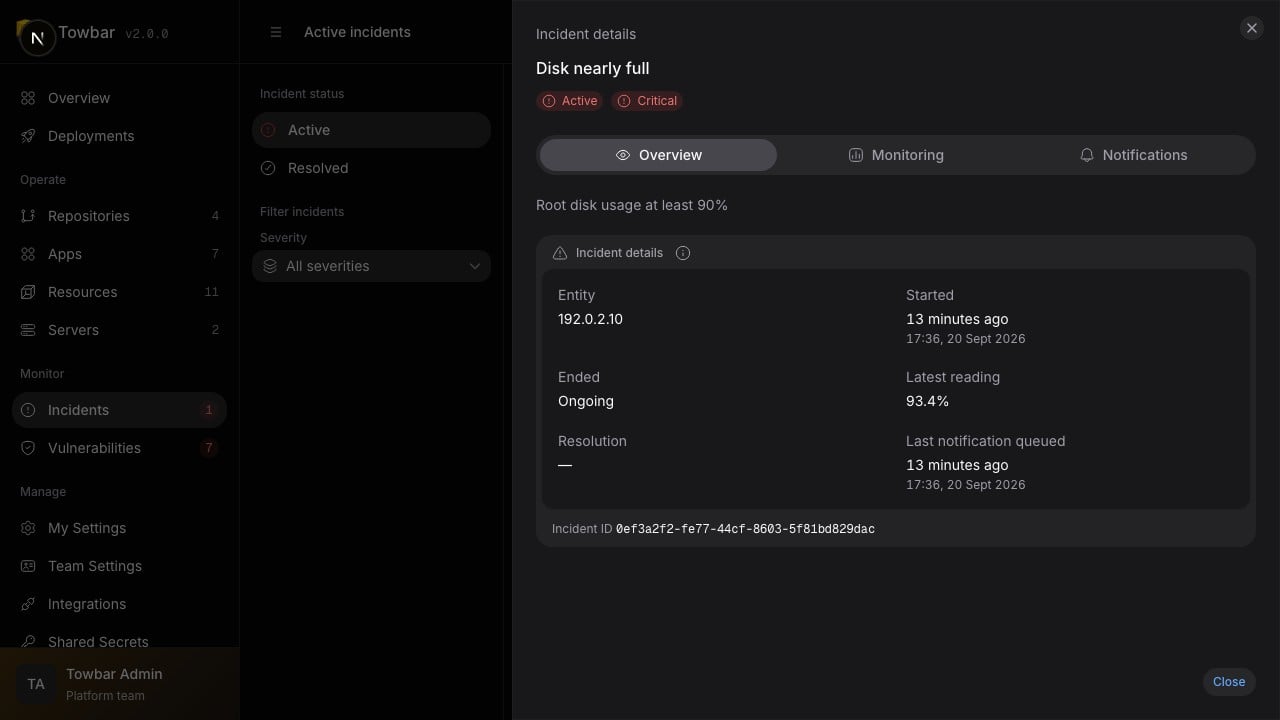
Select **View Incident** to open its details in a drawer without leaving the incident list. The **Overview** tab shows the original trigger condition, entity, status, severity, start and end times, latest or final reading, and when a notification was last queued. Dates include relative times.

The **Monitoring** tab shows the relevant graph. The **Notifications** tab lists the incident’s notification deliveries, including destination, delivery status, and queued and sent times. Delivery history is paginated. Queued or retrying notifications are distinct from successfully sent notifications; failures show an error code.

The monitoring chart covers the incident start through now, including after recovery, and refreshes every 30 seconds while open. It shows the relevant metric, the rule’s threshold, and a recovery or closure marker. Tooltip timestamps include the time zone. Longer periods use at most 361 points, preserving the highest reading for upper thresholds or the lowest for lower thresholds. Dotted bridges mark gaps between measurements; they are not measured values.

History follows the server’s retention setting. Restart windows use individual counter measurements available for the last 24 hours; report-age history is estimated from retained report timestamps. The drawer explains when older measurements or an older incident’s original configuration are unavailable.

<div className="towbar-doc-screenshot">
  <div className="towbar-product-light">
    <img src="https://mintcdn.com/avgeek/7IKQY5hBmeQaVMw0/assets/release-v2/incident-detail-light.jpg?fit=max&auto=format&n=7IKQY5hBmeQaVMw0&q=85&s=60c042f6551014a954e867d49a340ace" alt="Incident details show the affected entity, latest reading, and notification timing." width="1280" height="720" loading="lazy" data-path="assets/release-v2/incident-detail-light.jpg" />
  </div>

  <div className="towbar-product-dark">
    <img src="https://mintcdn.com/avgeek/7IKQY5hBmeQaVMw0/assets/release-v2/incident-detail-dark.jpg?fit=max&auto=format&n=7IKQY5hBmeQaVMw0&q=85&s=062e23178a0dc98cd0440fadeb3502fc" alt="Incident details show the affected entity, latest reading, and notification timing." width="1280" height="720" loading="lazy" data-path="assets/release-v2/incident-detail-dark.jpg" />
  </div>

  <p>
    Incident details show the affected entity, latest reading, and notification
    timing.
  </p>
</div>

## Measurements and incident states

Host and workload gauges use the reported metric units. The editor presents bytes as GiB and throughput as MiB/s; REST thresholds use bytes and bytes per second. For multiple instances, a gauge rule evaluates the worst instance reading rather than adding utilization percentages. Restart rules count increments within each container identity, not a new container's initial counter or a counter reset.

**Healthy** means the latest evaluation does not meet the trigger condition, or an active incident has cleared. **Alerting** means the condition is active. **No recent data** cannot prove recovery: missing measurements are not treated as zero. **Scout inactive** means collection is intentionally disabled or the workload is no longer assigned to the server.

Metric rules require Scout Agent to be enabled. Missing-report rules include an installation grace period and do not alert on intentional uninstall. Public HTTP checks are performed by the control plane and do not require an installed agent.

Deleting or disabling a rule, changing its condition, or removing its monitored workload closes its incident with an explicit reason. That is different from recovery and does not send a recovery notification. Active incidents remain visible; resolved incidents follow the server's Scout retention setting, defaulting to 15 days when no agent is installed.

## Public HTTP checks

Choose **Public HTTP endpoint** as a server rule's metric. Set a public HTTP or HTTPS URL, request method, expected status range, interval, and timeout. Only use endpoints that are safe to request repeatedly.

* **GET** or **HEAD**, every 30 to 300 seconds in 30-second increments.
* A total timeout from 1 to 10 seconds, including DNS resolution and redirects.
* A healthy HTTP status range, defaulting to 200–299.
* Zero to three redirects; redirects are not followed by default.
* An unavailable result triggers an alert immediately. Recovery follows the first successful check.

An unexpected status, timeout, DNS/connection failure, or invalid TLS certificate counts as unavailable. A blocked destination is shown as a check error and cannot establish recovery. Each redirect is resolved and validated separately. Private, loopback, link-local, reserved, and metadata-service addresses are blocked, including mixed public/private DNS answers. Connections are pinned to the validated address. Only ports 80 and 443 are accepted; custom headers, credentials, cookies, and request bodies are not supported. Response bodies are not buffered or retained.

These checks measure availability **from your Towbar control plane**. They are not a geographically distributed uptime service and cannot detect an outage of the control plane itself. Keep an independent external check for Towbar if you need that coverage.

## Notification destinations

Configure provider credentials and category routes with `TOWBAR_NOTIFICATIONS_ENABLED` and `TOWBAR_NOTIFICATION_CONFIG_JSON`, then restart the API. See [notifications](/docs/integrations/notifications) for the schema. Server and workload alerts use the matching environment-configured routes.

Every valid route is active until the runtime environment changes; there are no per-rule channel selections. Incidents and notification delivery are separate: an active incident does not prove that a provider received the message. Inspect delivery outcomes in the notification center.

Firing and recovery transitions are saved with durable notification intents. Concurrent evaluations do not create duplicate active incidents. An active incident does not send repeat alerts. Recovery messages are sent only to destinations that successfully received an earlier alert for that incident. Changing configuration or disabling a rule suppresses queued messages that no longer apply. A message already being sent may still arrive.

## API and MCP

All routes below are relative to `/v1/api` and use [API key authentication](/docs/api/authentication). Reads accept Read-only or Edit keys. Mutations require an Edit key with alert configuration permission; personal keys must belong to an Admin or Member. Provider credentials and notification routes cannot be changed through the API.

| Task                                    | Route                                                    |
| --------------------------------------- | -------------------------------------------------------- |
| Rules, evaluations, and destination IDs | `GET /servers/{serverId}/scout-alerts`                   |
| Create rule                             | `POST /servers/{serverId}/scout-alerts/rules`            |
| Replace rule settings                   | `PUT /servers/{serverId}/scout-alerts/rules/{ruleId}`    |
| Delete rule                             | `DELETE /servers/{serverId}/scout-alerts/rules/{ruleId}` |
| Incident history                        | `GET /servers/{serverId}/scout-alerts/incidents`         |

Rule inspection also accepts `deployableId` to filter before the result limit: use a workload UUID or `server`. Omitting it returns rules across the server and its workloads for API discovery.

Incident history accepts `state=active|resolved|all`, an optional `deployableId` (a workload UUID, or `server` for server-only incidents), and `limit` up to 50. Pass both `nextBefore` and `nextBeforeId` as `before` and `beforeId` for the next page.

MCP provides `towbar_alerts_inspect`, `towbar_alerts_configure`, and `towbar_alerts_remove`. Discover IDs before mutation, inspect the current rule before replacing it, and preserve settings the user did not request changing. See the [tool reference](/docs/api/mcp-tools) and the Scout Alerts API section for full schemas.