
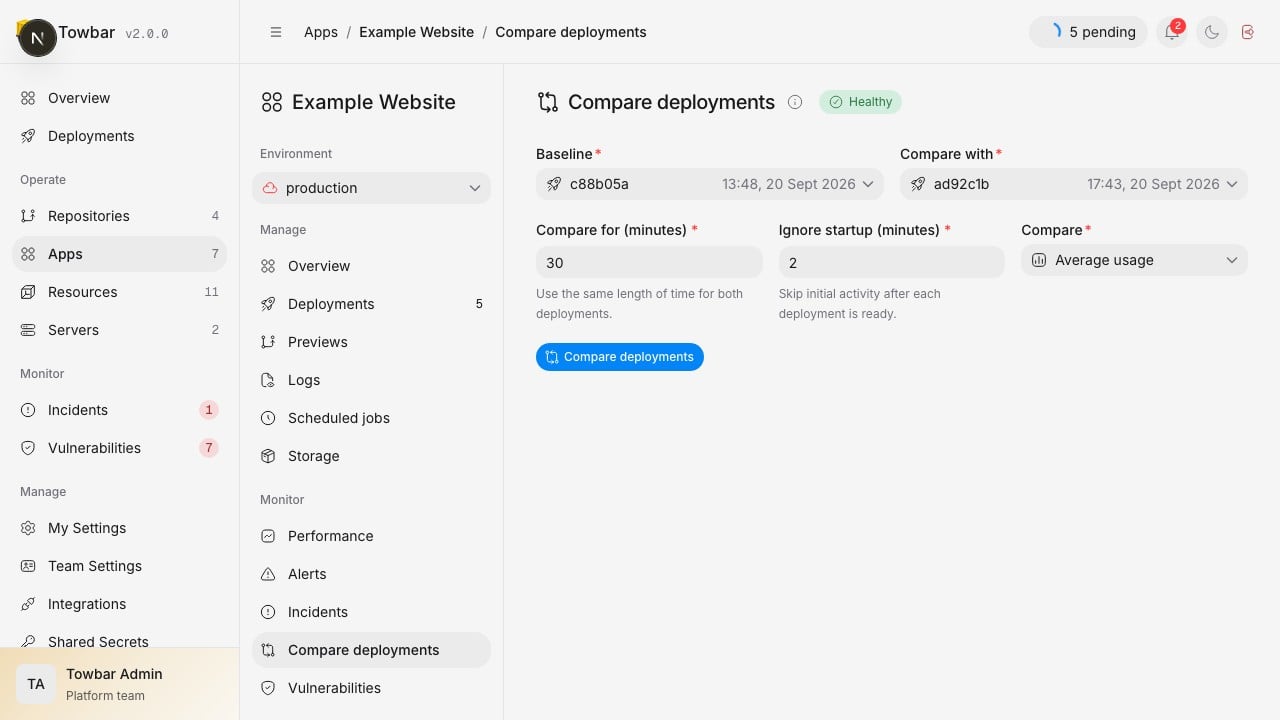
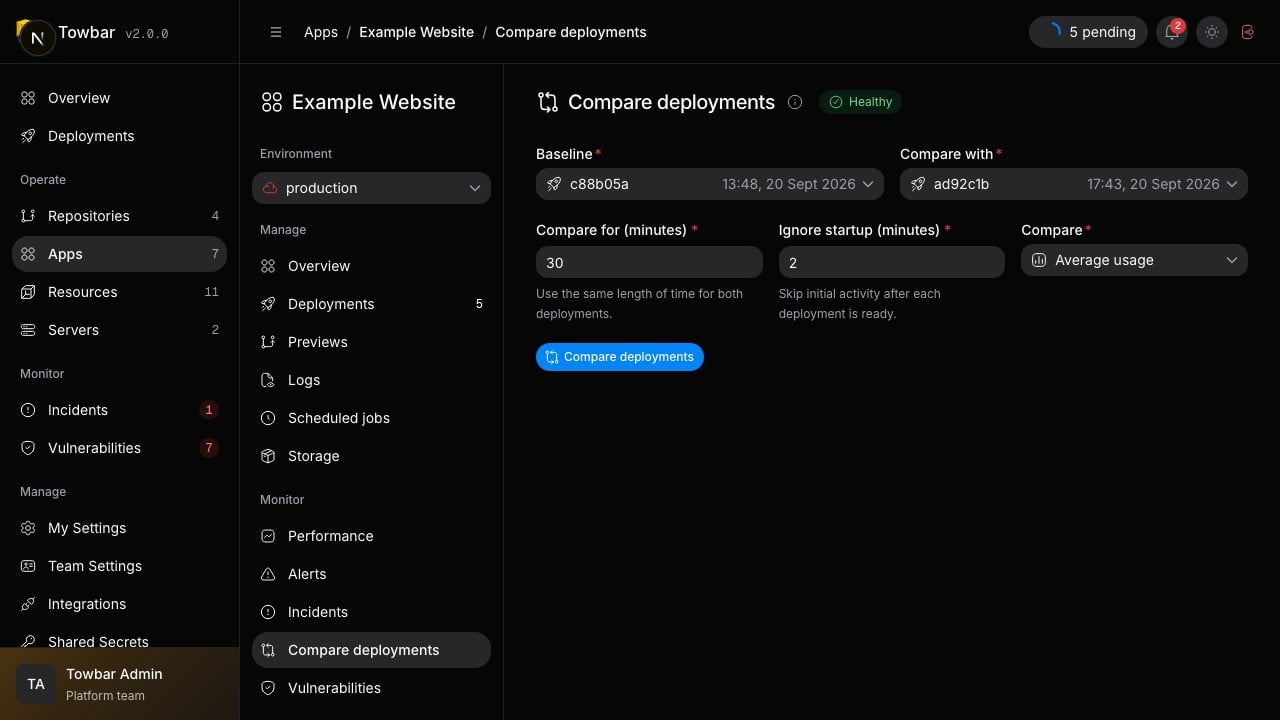
Compare resource usage over equal periods after two deployments became ready.
Choose a fair window
Each window starts after the deployment’s recorded completion time plus your warm-up period. The default compares 30 minutes, skipping the first 2 minutes. Configure a window from 5 minutes to 24 hours and warm-up from zero to 60 minutes. Charts align by time since the start of each observation window. For example, the ten-minute point compares the tenth minute of both deployments, even if they shipped on different days. The selectors show each deployment’s commit and date. The results report coverage for the selected windows. Choose Average usage for sustained resource demand or Peak usage for spikes. Averages are weighted by sample count. Peak totals sum each container’s maximum within a reporting interval; these maxima may not have occurred at the same instant. Comparisons across servers or changed configuration include a warning.Read the result
The default sensitivity requires at least 20% change and an absolute change of 0.05 CPU cores or 16 MiB memory. Configure these under Advanced comparison settings. The minimum required coverage defaults to 80% and can be set from 50% to 100%. Relative change from a zero baseline is undefined; the absolute threshold still applies.
CPU is compared in consumed cores and memory in bytes, so changing a container’s configured limit does not make an identical workload appear cheaper merely by changing the denominator. Network received/sent and block read/write are available as context. Restarts count observed counter increments within the deployment’s container identities; missing counter data is not reported as zero.
Coverage is calculated against the full requested window. A deployment that is still collecting data does not receive an artificially complete score. Partial boundary buckets are excluded from the comparison, and expired history cannot be reconstructed by increasing retention. Missing chart sections remain gaps.
A change in resource usage is a signal to investigate, not proof of a code regression. Compare similar traffic, workload, configuration, and hardware. Scout does not infer request latency, request error rate, or business throughput from CPU and memory counters.
API and MCP
UseGET /v1/api/workloads/{deployableId}/comparison-deployments to discover successful deployment IDs. Then request GET /v1/api/workloads/{deployableId}/deployment-comparison with:
The response includes deployment metadata, equal observation windows, bounded points, metric summaries and deltas, restart information, and coverage warnings. These are read-only operations scoped to the authenticated workspace.
For MCP, call
towbar_deployment_compare with workloadId to discover candidates, then supply baselineId and candidateId. It returns summaries by default. Set includePoints=true for at most 24 representative points per deployment; summaries still use all available measurements. See the MCP tool reference.