
Scout Agent is Towbar’s monitoring agent. Install it on a server to follow CPU, memory, disk, and network usage over time, including the apps and resources running there.
Install Scout Agent
Open a server, choose Settings → Scout Agent, select a retention period, and acknowledge installation. Choose Install Scout Agent. The server must already be prepared, with its SSH credential and a trusted host key configured. Scout Agent runs as two small systemd services: a local collector and an HTTPS sender. Both start after a reboot and restart after a crash. The collector reads host counters and Towbar-labelled Docker containers every 30 seconds. The sender reports to your own Towbar API; it does not open an inbound port on the server. Installing means the worker is setting up the services. Awaiting report means installation completed but no sample has arrived yet. Online requires a received sample. No recent report appears when the latest collection is older than 90 seconds; old data is never presented as a fresh zero.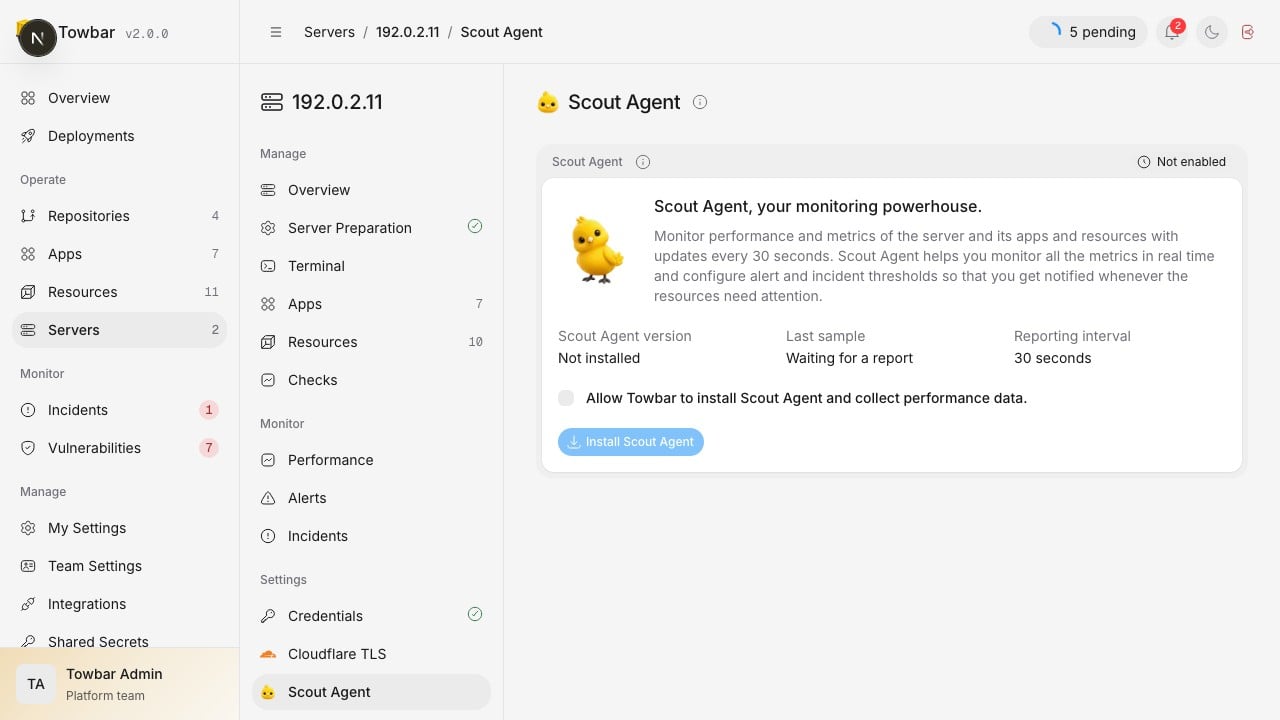
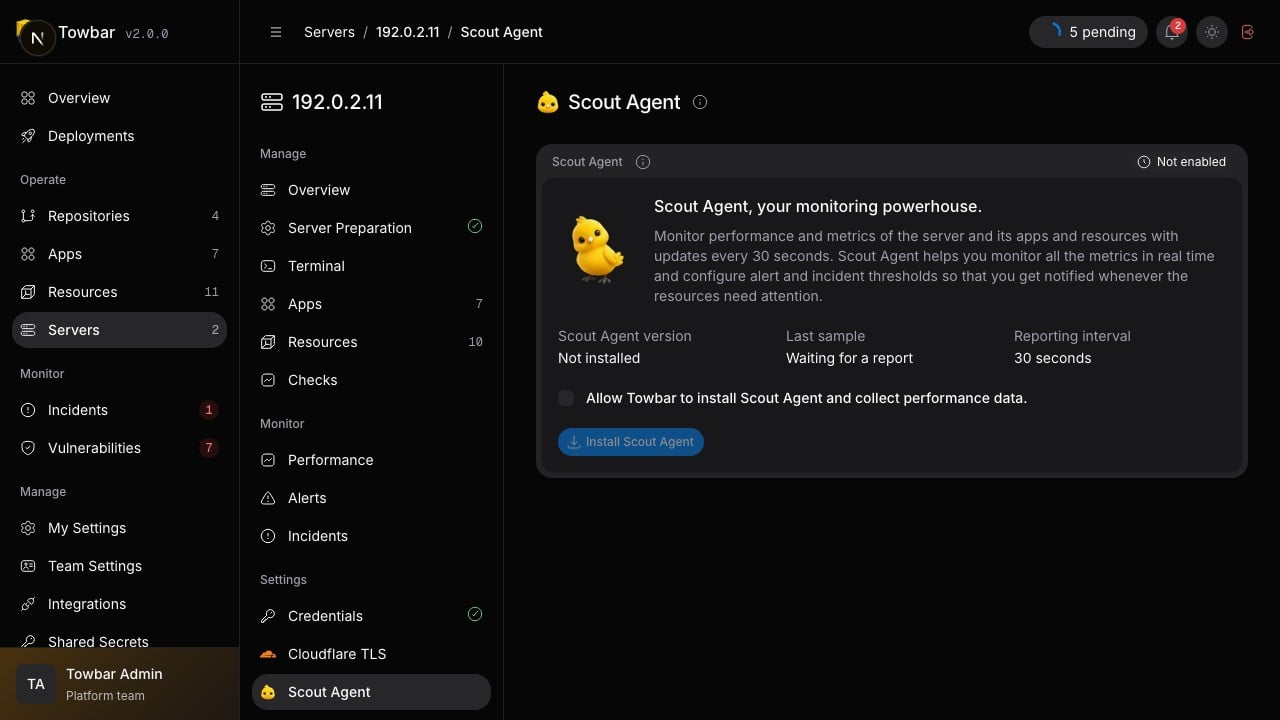
Choose retention and consent before installing Scout Agent.
Performance history
The Scout Agent column on the Servers list shows CPU (top) and memory (bottom) trends for the last 30 minutes while the agent is online. Graphs are green, with readings above 80% in red, and refresh every 30 seconds. Hover a graph to identify the metric, or select the cell to open performance history. Missing measurements leave gaps. Agents that are disabled or not online show Inactive without charts. Open Monitor → Performance in the secondary sidebar on a server, app, or resource to view performance history. The page stays available when monitoring is off, with links to the server’s Scout Agent settings and this guide.- Server metrics include CPU usage, CPU count, load, memory, swap, root/Docker filesystem capacity, disk I/O, network traffic, and uptime.
- Container metrics include CPU consumption and its limit, memory consumption and its limit, network and block I/O, restart count, state, and health when Docker provides it.
- Percentage charts include a red dotted reference line at 80% usage.
- Charts default to Last 15 minutes. Choose Last 15 minutes, Last 30 minutes, or a longer relative range through 60 days, limited by the server’s retention setting. Switch between Average and Peak, and hover to read exact values at the same time across charts.
- App and resource history survives container replacements. Each line represents an individual container. Choose Production or Previews, then an instance when you need to isolate it.
- Dotted connectors bridge periods with no measurements; they do not represent recorded values. Graph markers identify deployments (D) and container restarts (R). Hover or focus a marker for its status and time. The deployment and restart events table follows the selected duration and shows 10 events per page, newest first. Each query is capped at the latest 200 events; a notice appears if older events were omitted. Choose a shorter duration to inspect those periods. Tooltip timestamps include your local time zone.
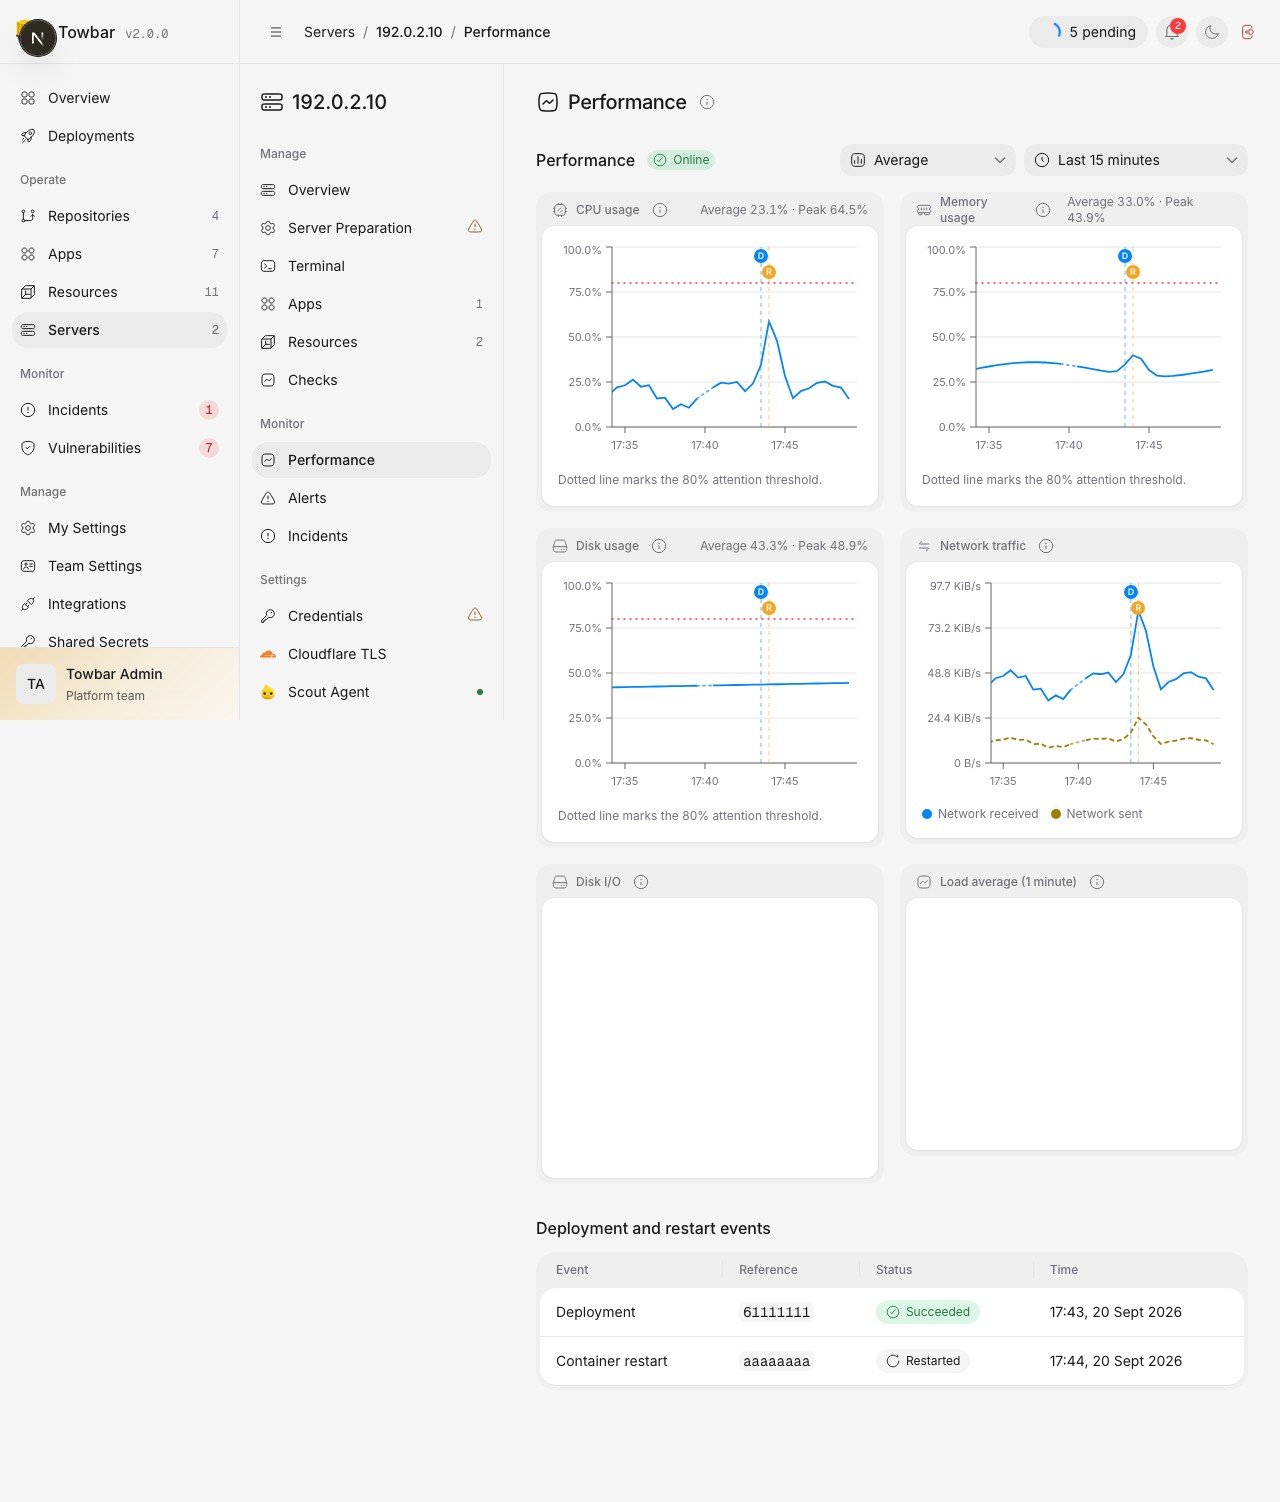
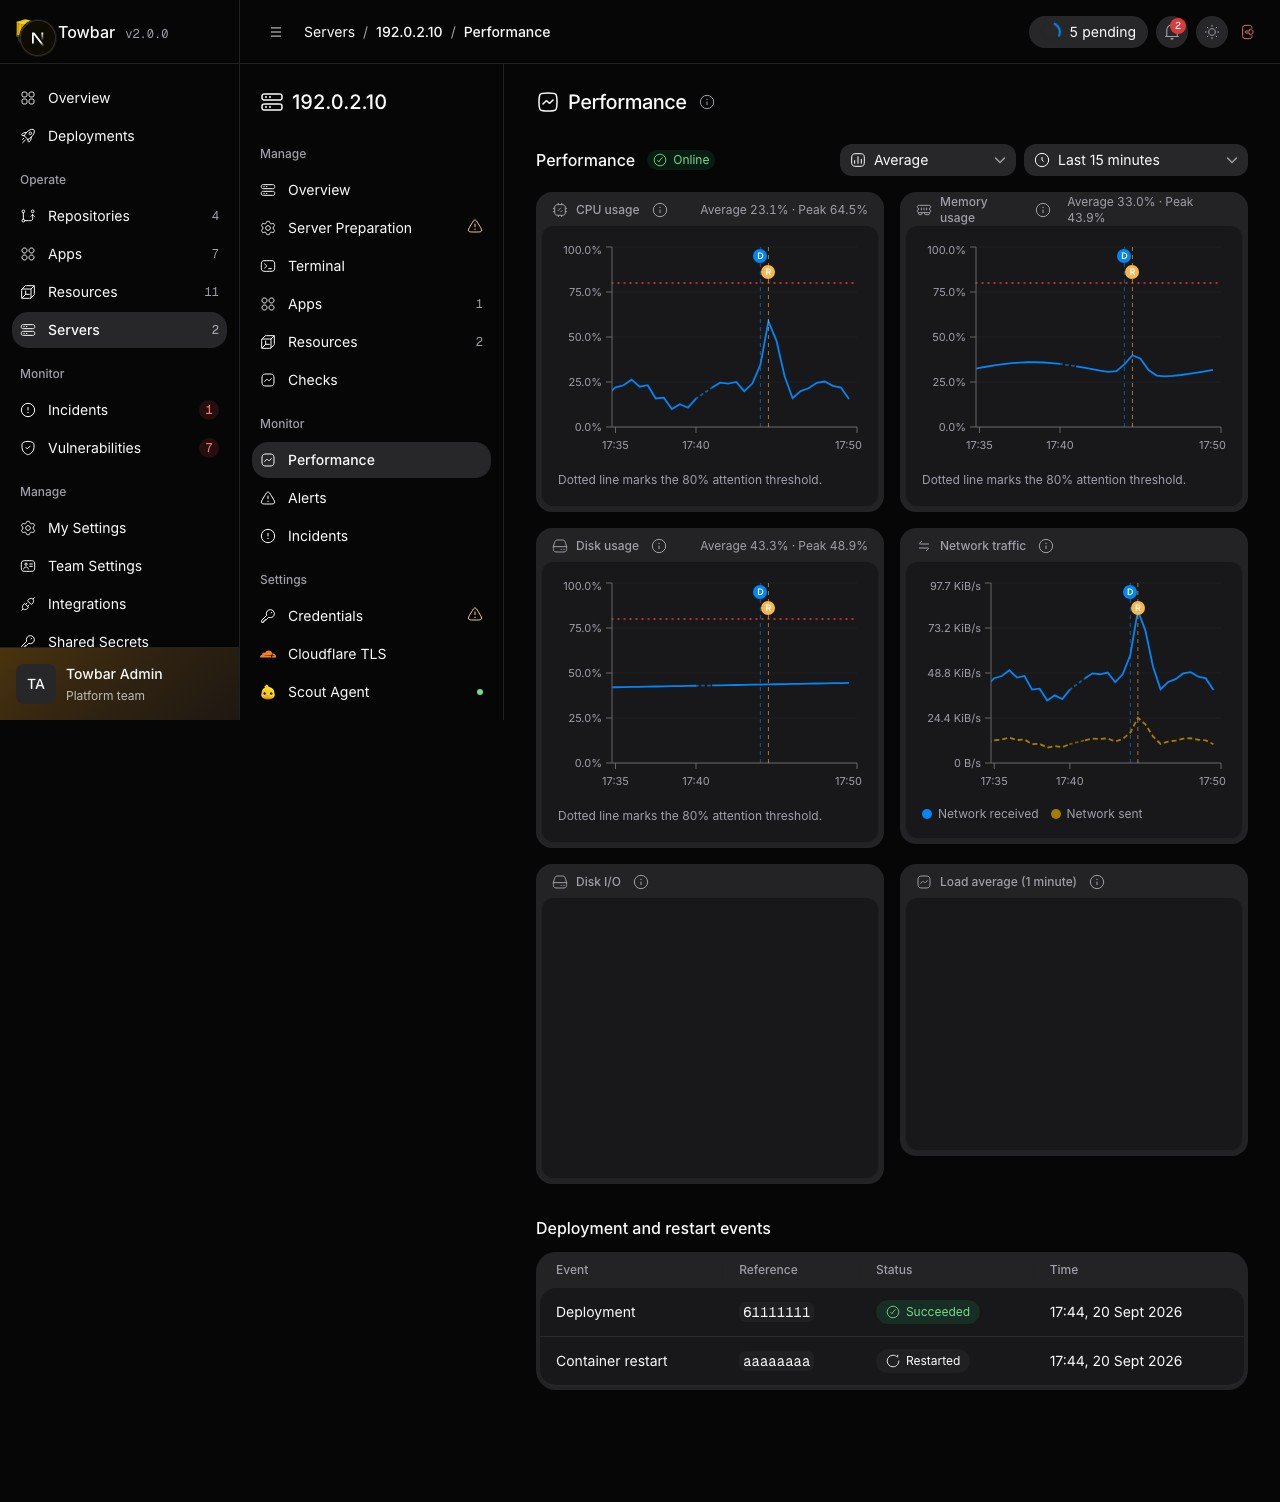
Performance history combines measurements, aggregation controls, and deployment markers.
Alerts and deployment comparisons
Use Monitor → Alerts to configure metric rules and public HTTP checks. Scout Alerts covers thresholds, automatic recovery notifications, enablement, and incident history. On an app or resource, Compare deployments aligns equal periods after two releases became ready. Deployment comparisons explains sensitivity, sample coverage, and the limits of inferring a regression.Retention and resource limits
Retention defaults to 15 days. Choose 7, 15, 30, or 60 days per server. Raw 30-second samples are kept for 24 hours, then compacted into one-minute summaries. The maintenance worker compacts and expires records in bounded batches. Reducing retention expires older history permanently; increasing it cannot recover expired data. Each agent service has a 64 MiB memory ceiling and a CPU quota of 5% of one CPU. The retry buffer holds at most 10 MiB or one hour, whichever is reached first. Oldest samples are dropped when the buffer fills, and diagnostics report dropped samples. The services share a separate volatile journal capped at 8 MiB. A backend outage does not accumulate logs or metrics indefinitely. Collection is limited to 512 Towbar-labelled containers per server, four concurrent Docker reads, and a 20-second collection deadline. Unavailable measurements are omitted and reported in diagnostics. The agent does not store or transmit application environment variables, secrets, or log contents.Credentials and connectivity
The worker installs a dedicated credential scoped to one server. It only authorizes metric ingestion and cannot call the control-plane API or MCP. Updates rotate this credential. The collector and sender use separate service accounts; only the sender reads the upload configuration. Docker access is privileged, so only enable the agent on a server you trust. The configuredTOWBAR_API_BASE_URL must be an HTTPS URL reachable from the server. The agent validates the certificate and never follows redirects with its credential. Ensure outbound DNS and HTTPS are available. Monitoring uploads have separate limits from API/MCP traffic: 120 requests per server per minute and 600 per originating IP per minute, including buffered catch-up traffic.
Update, uninstall, and remove a server
Choose Update Scout Agent to install the version bundled with the current Towbar worker. Reporting may pause briefly while services restart. Uninstall Scout Agent immediately revokes the upload credential, then stops the services and removes the binary, configuration, and retry buffer. Existing history follows its retention period. A failed uninstall keeps SSH credentials available for retry. Removing a server revokes its monitoring access and stops future collection in Towbar. Active operations must finish first. The machine, running services, and Docker data remain on the host. Follow server removal to review the effects on assigned workloads.Troubleshooting
Check the agent status and last sample time in Scout Agent. On the server:/etc/towbar-monitoring/config.json; it contains the upload credential. If credentials were revoked, update or reinstall the agent from Towbar. For missing container metrics, verify Docker is running and the containers retain their Towbar ownership labels.
API and MCP
Use the normal API key authentication for management and history:
Installation requires
{"acknowledge": true, "retentionDays": 15}. Retention updates require {"retentionDays": 15}. Management requires an Edit key with Scout configuration permission. Admins and Members can grant that permission to their personal keys. Read-only keys can inspect monitoring within their workspace.
History accepts range=15m|30m|1h|6h|24h|7d|15d|30d|60d|custom, environment=production|preview, and an optional previewId. For range=custom, also provide startAt and endAt as ISO 8601 timestamps with a time-zone offset (for example, 2026-09-07T10:00:00Z). Samples and events use the same time bounds, and existing point, instance, and event caps still apply. The agent-only ingestion endpoint is not a user API route.
MCP provides towbar_performance_inspect for performance summaries and representative history points, and towbar_monitoring_configure for acknowledged installation, retention, or uninstall. towbar_server_inspect includes monitoring status. See the MCP tool reference for arguments.